2022Pitch
Turning presentation views into insight
This case study follows the end-to-end design of Presentation Analytics, a feature that helped teams understand what happened after they shared a presentation.
The feature launched to every Pitch Pro workspace, reached #5 Product of the Day on Product Hunt, and became part of how fundraising, sales, and marketing teams shared their work.

OverviewThe story starts after you share
Pitch is a collaborative presentation platform. Creating the deck is only half the job. The other half starts when you share it.
Before this project, that part was invisible. You could send a presentation to anyone, but you had no idea whether they opened it, where they lost interest, or if they came back. Presentation Analytics closed that loop.
First winStarting small with Public Views
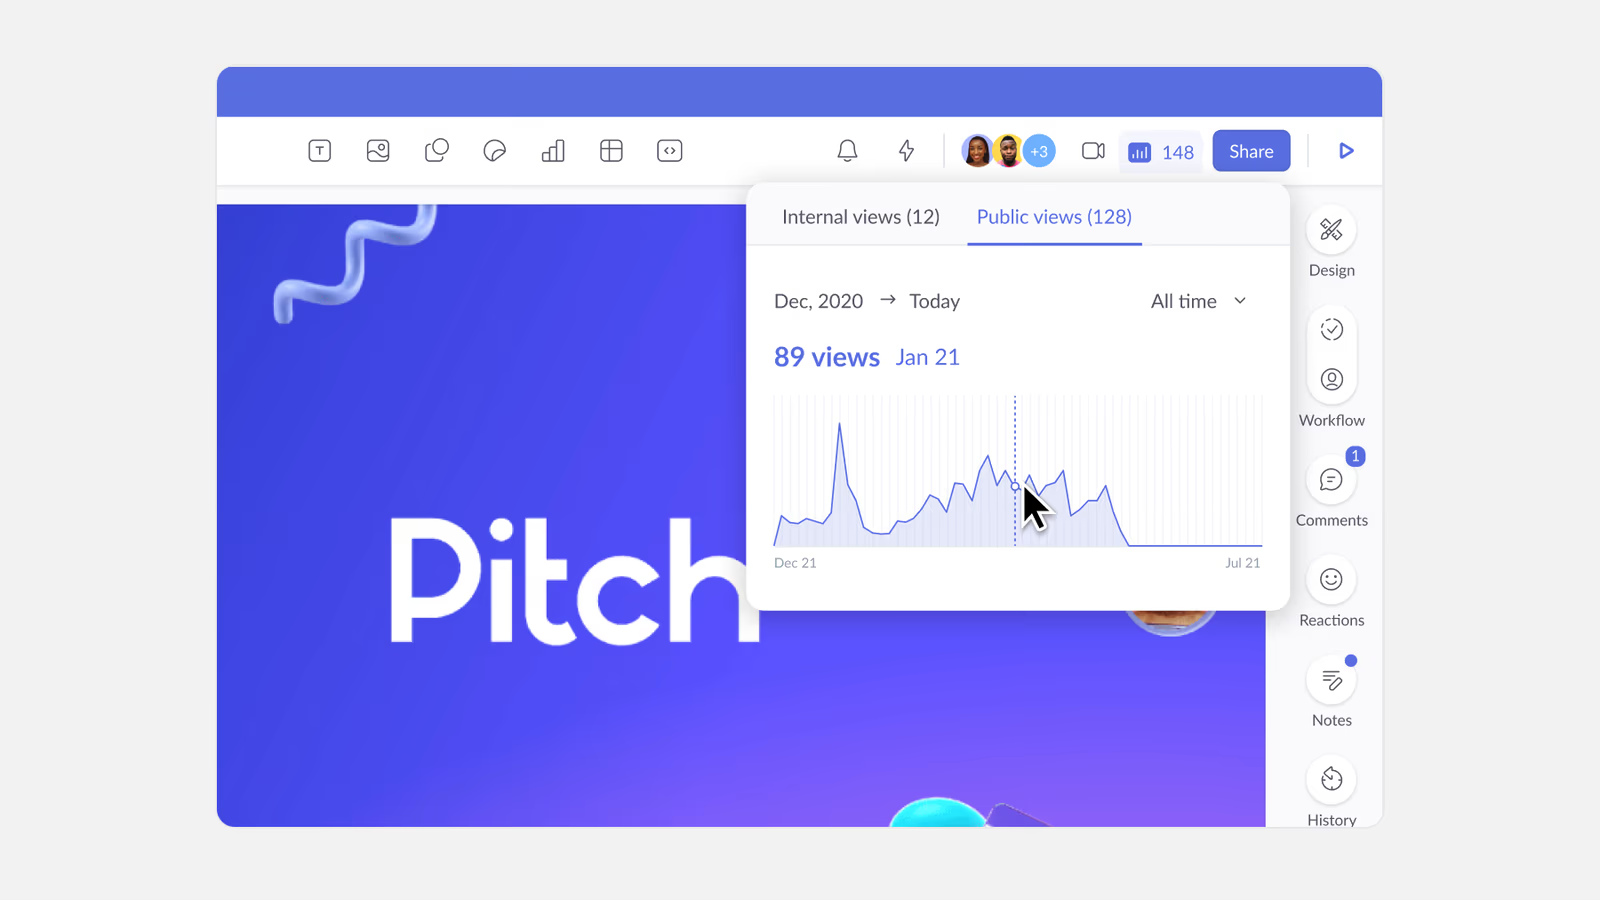
Rather than build a complete analytics platform, we launched Public Views in beta for a small group of users. It answered one question:
How many times has my presentation been viewed?
The goal was to learn whether analytics solved a real problem and what people expected from it. Every visit counted as a view. Unique visitors would come later, once the technical and privacy challenges were solved.

ChallengesDesigning analytics people could trust
Once the beta proved the demand, the next challenge wasn't more charts. It was finding a reliable way to measure unique viewers. 100 views from one person and 100 views from 100 people mean very different things.
As a European company, Pitch had to design for privacy from day one. GDPR and ePrivacy limited how we could identify visitors, and interviews showed many creators were uncomfortable tracking recipients with cookies or personal identifiers.
How can we recognize a unique visitor without identifying who they are?
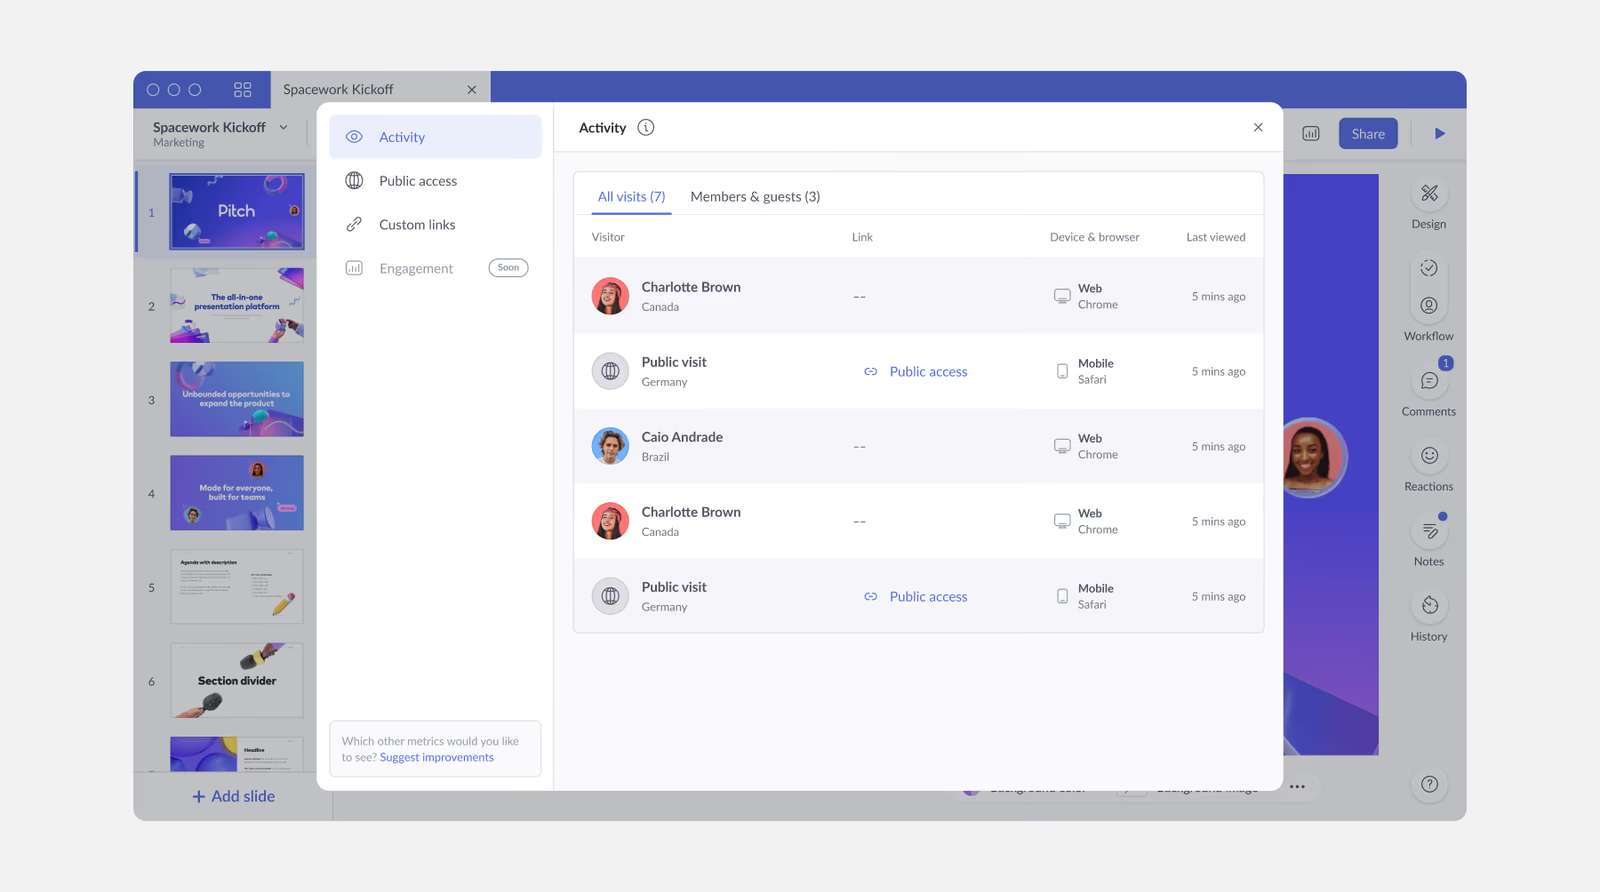
- Last time opened
- Geolocation
- Device
- Browser
- Name
- Company
- Viewing history
- Cross session tracking
SolutionsRecognition without identification
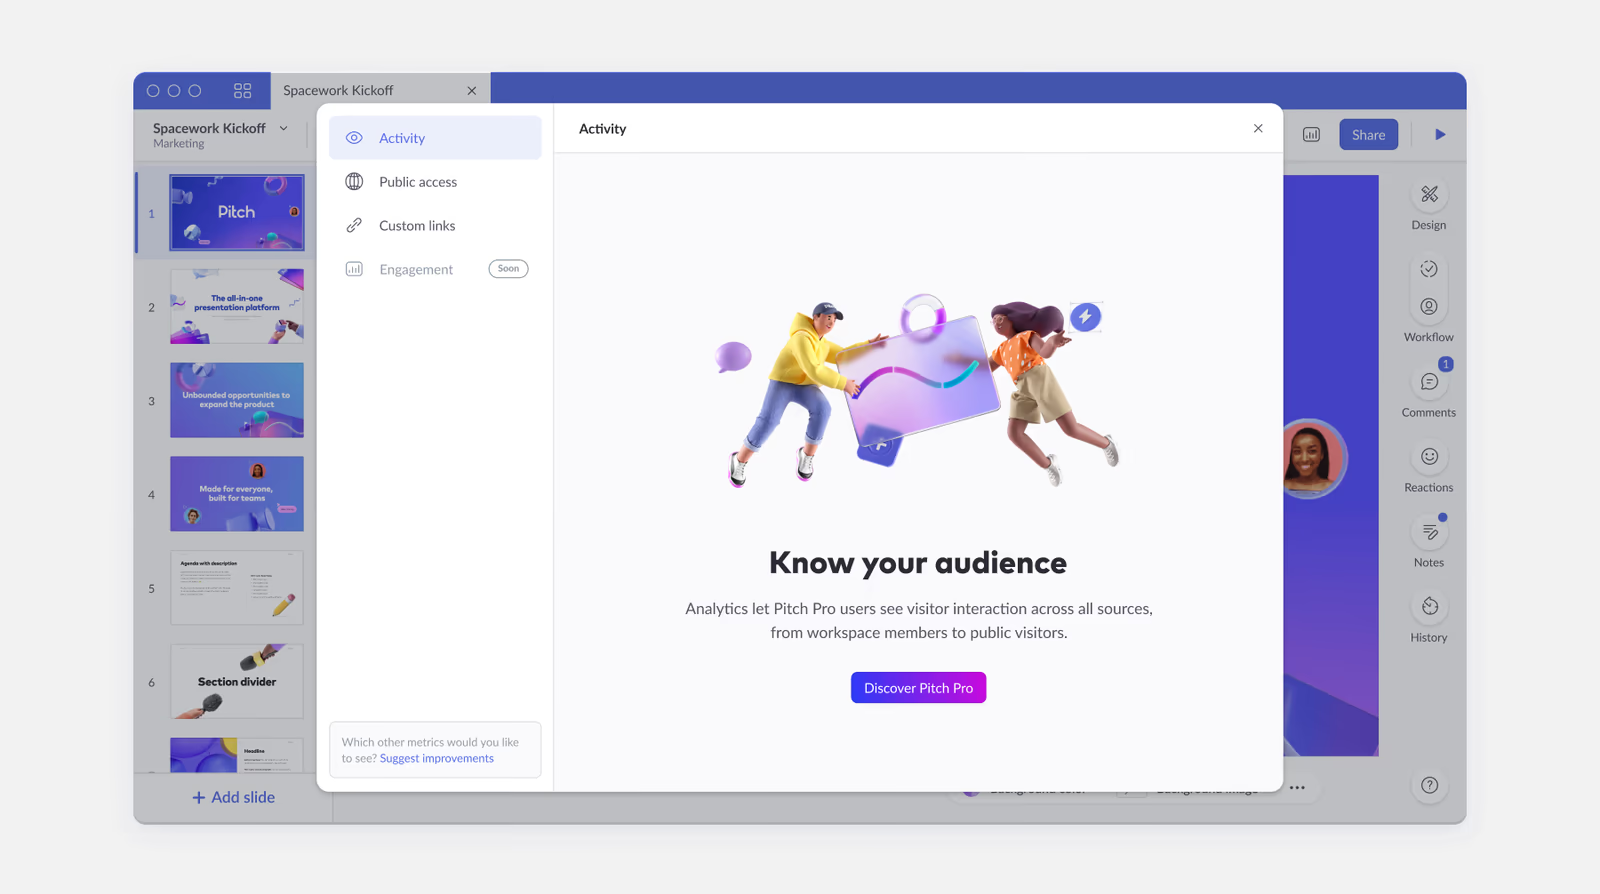
The answer was a hybrid approach. Workspace members were already signed in, so they could be recognized without extra tracking. External visitors stayed anonymous, so we could measure engagement without personally identifiable information.


IteratingSharing multiple links per presentation
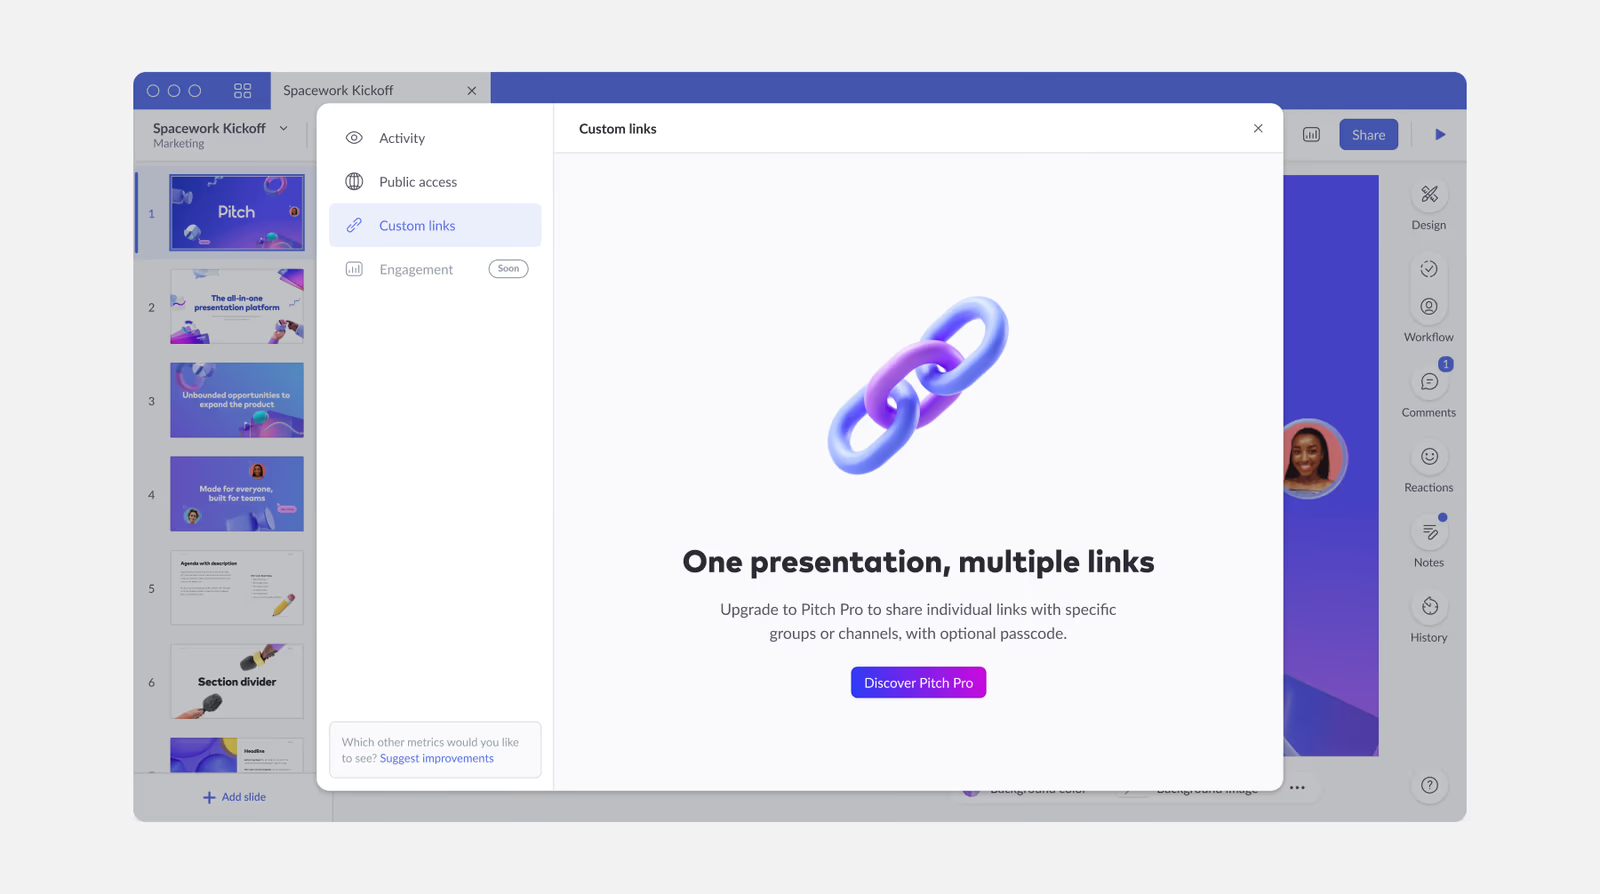
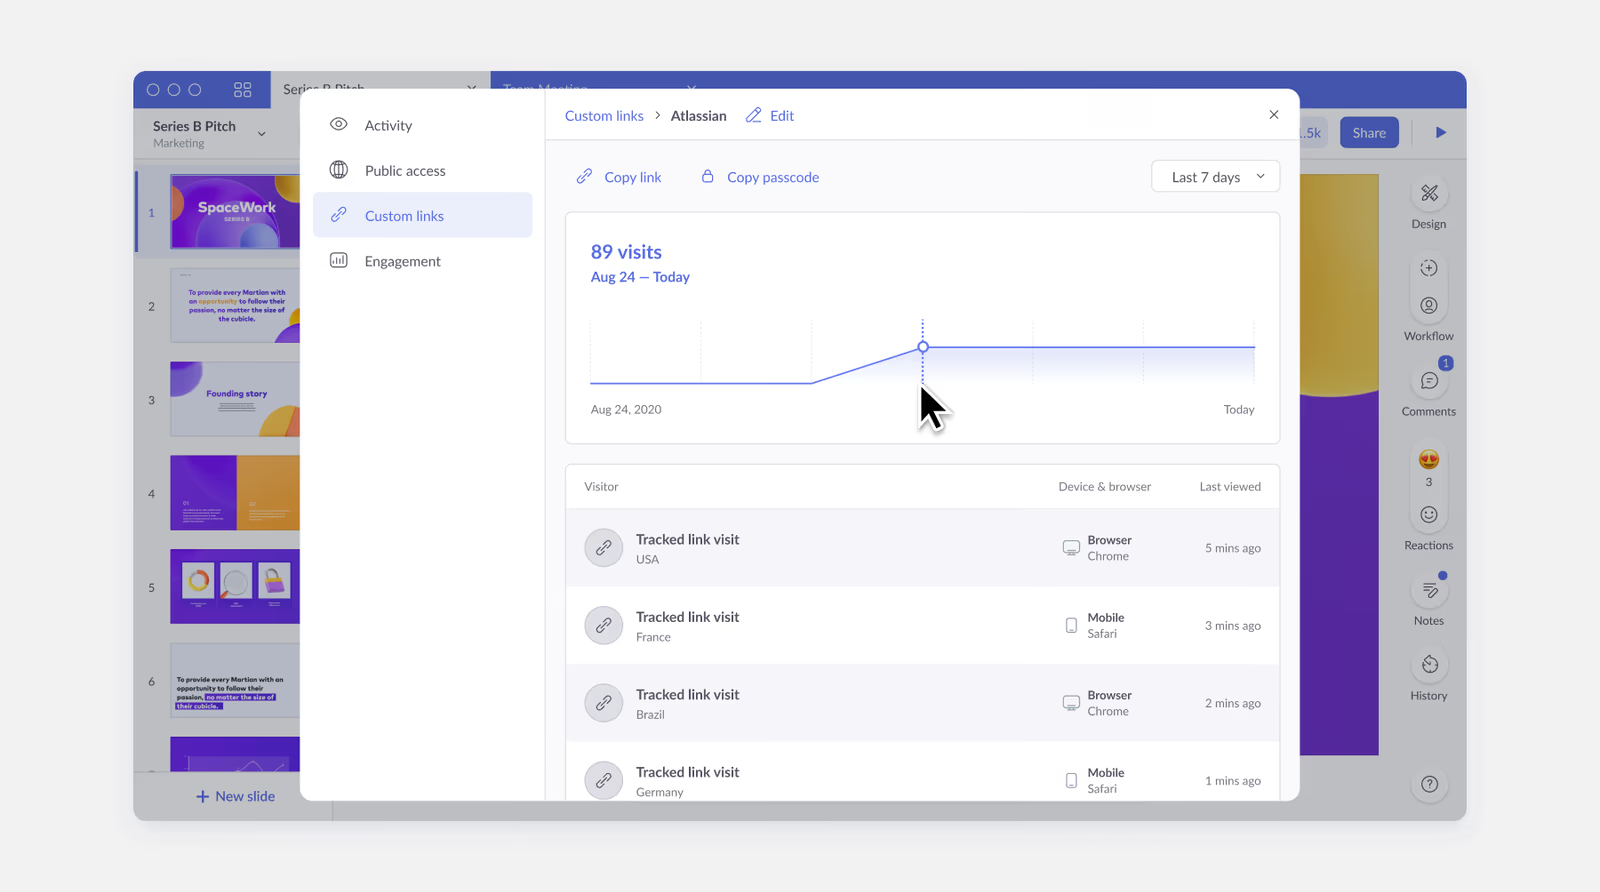
Teams rarely shared a deck with one audience. Fundraising, sales and marketing each needed their own numbers. Custom Links gave every link its own analytics, with the same privacy model.



Next upUnderstanding engagement
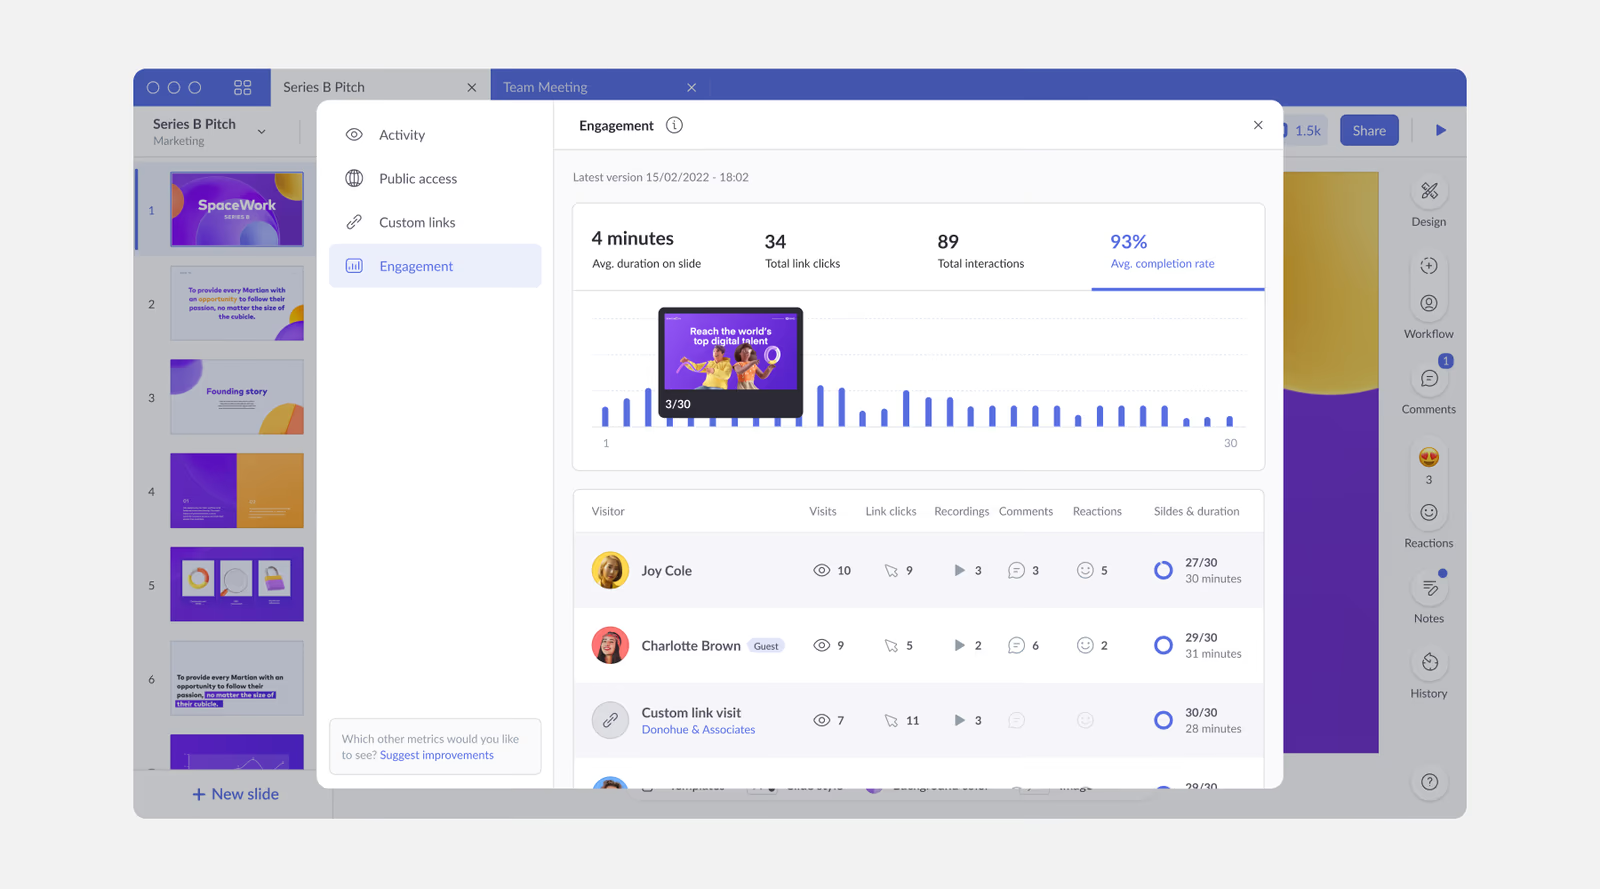
The MVP answered whether people wanted analytics. The next challenge was making them useful. Customer interviews kept pointing to three questions:
- Who viewed my presentation?
- Which slides kept their attention?
- How did engagement differ across audiences?

EvolutionAudience & Workspace Analytics
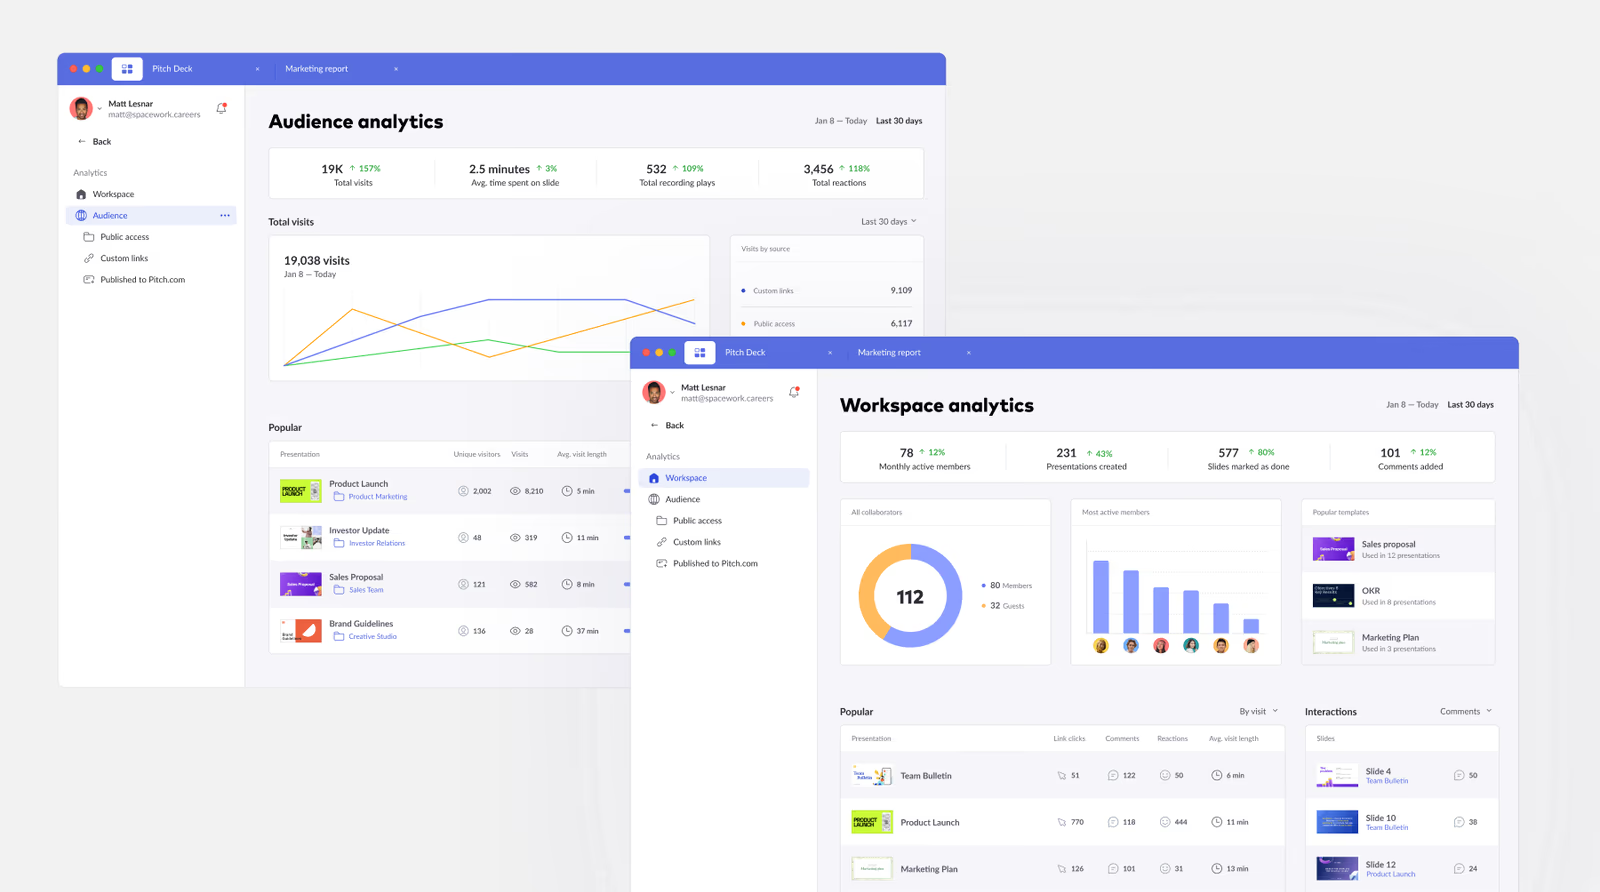
The longer-term vision went beyond individual presentations: engagement across customers, campaigns and the whole workspace, as part of broader business reporting.

ResultsShipping the foundation
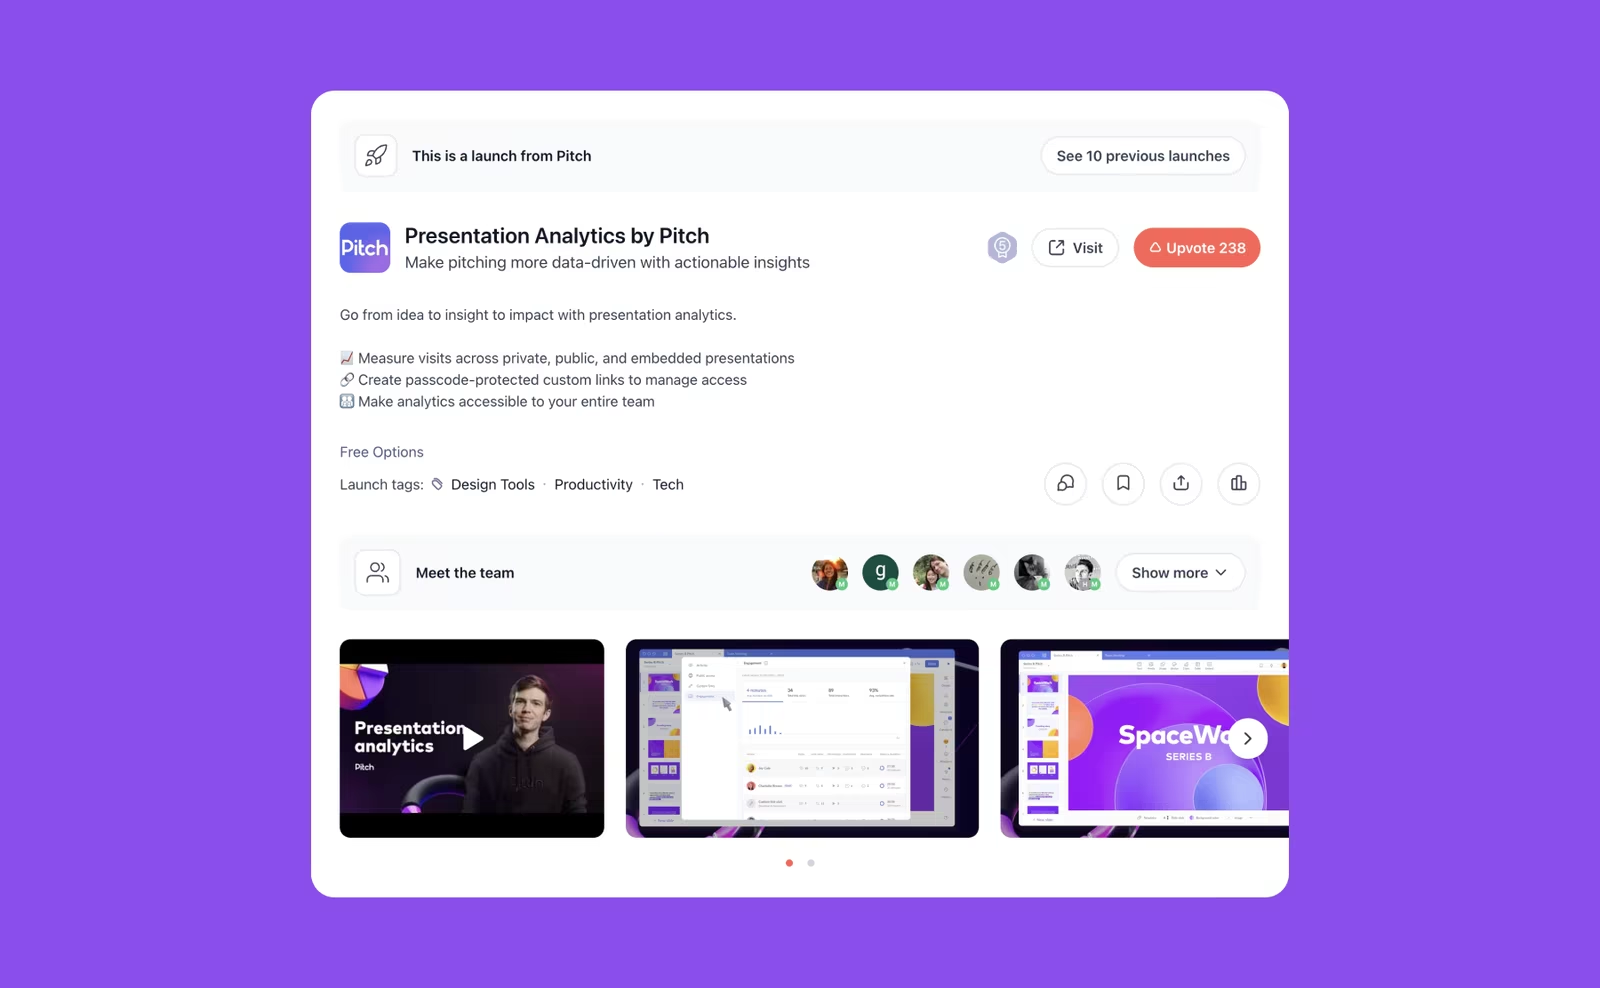
Presentation Analytics launched to every Pro workspace, became one of Pitch's most requested features, and reached #5 Product of the Day on Product Hunt. It also validated starting small: a focused MVP, real usage, then expansion.

ReflectionsLessons learned
When building analytics dashboard, the smallest useful release often teaches more than months of planning.
I'm proud we resisted building everything at once. Analytics looks obvious in hindsight, but every metric carries product decisions, technical tradeoffs and user trust. I left before every planned iteration shipped, but it's rewarding to see many of the concepts become part of the product.